
Lysol Disinfecting Wipes
Redesigning the main image for a wipes multipack.
I led the image strategy for a 320-count multipack and ran the Amazon A/B test.
Explore the case01 / Design problem
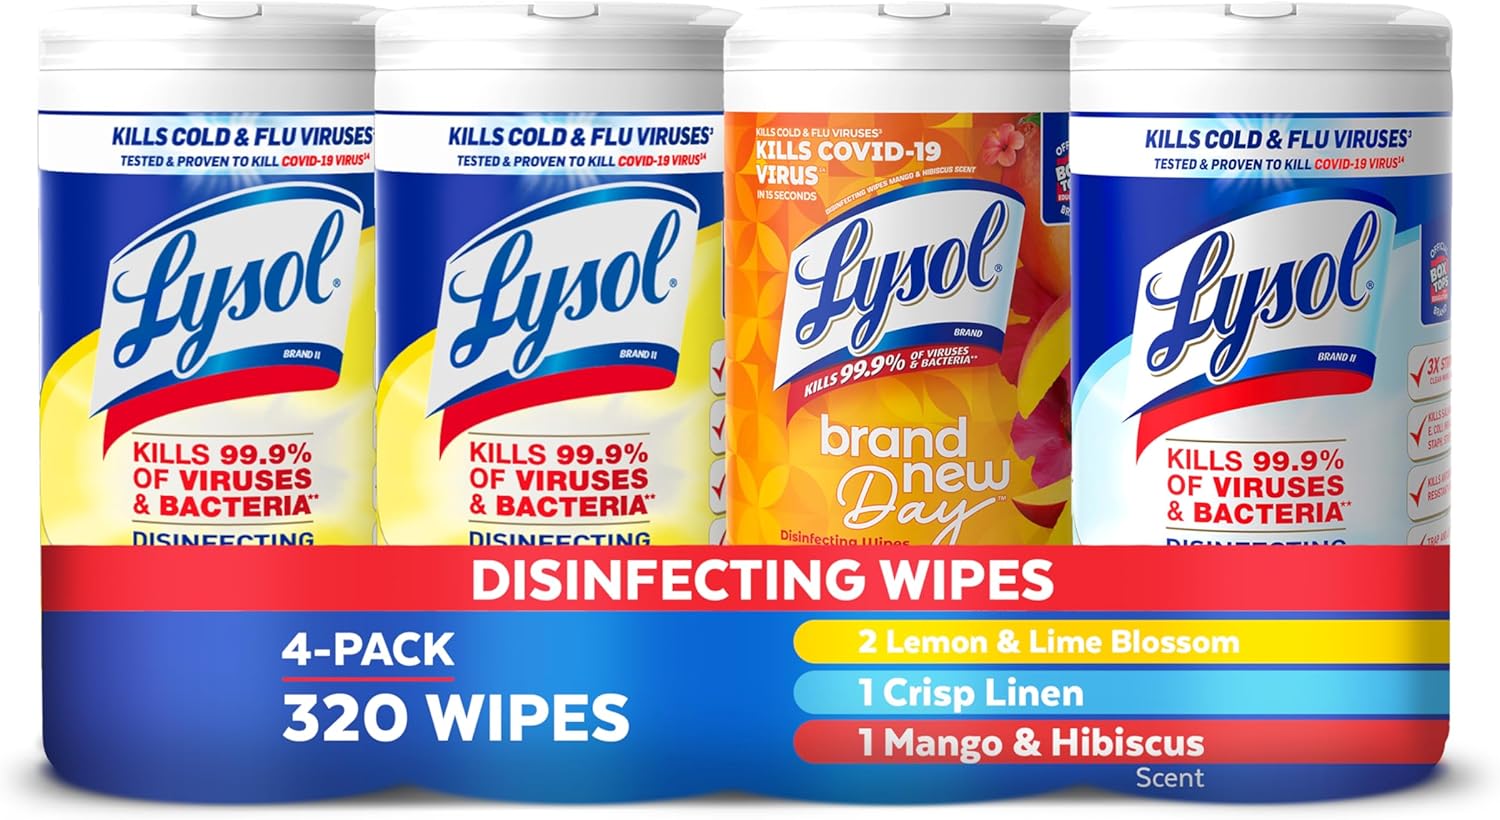
The pack count and scent labels lacked prominence.
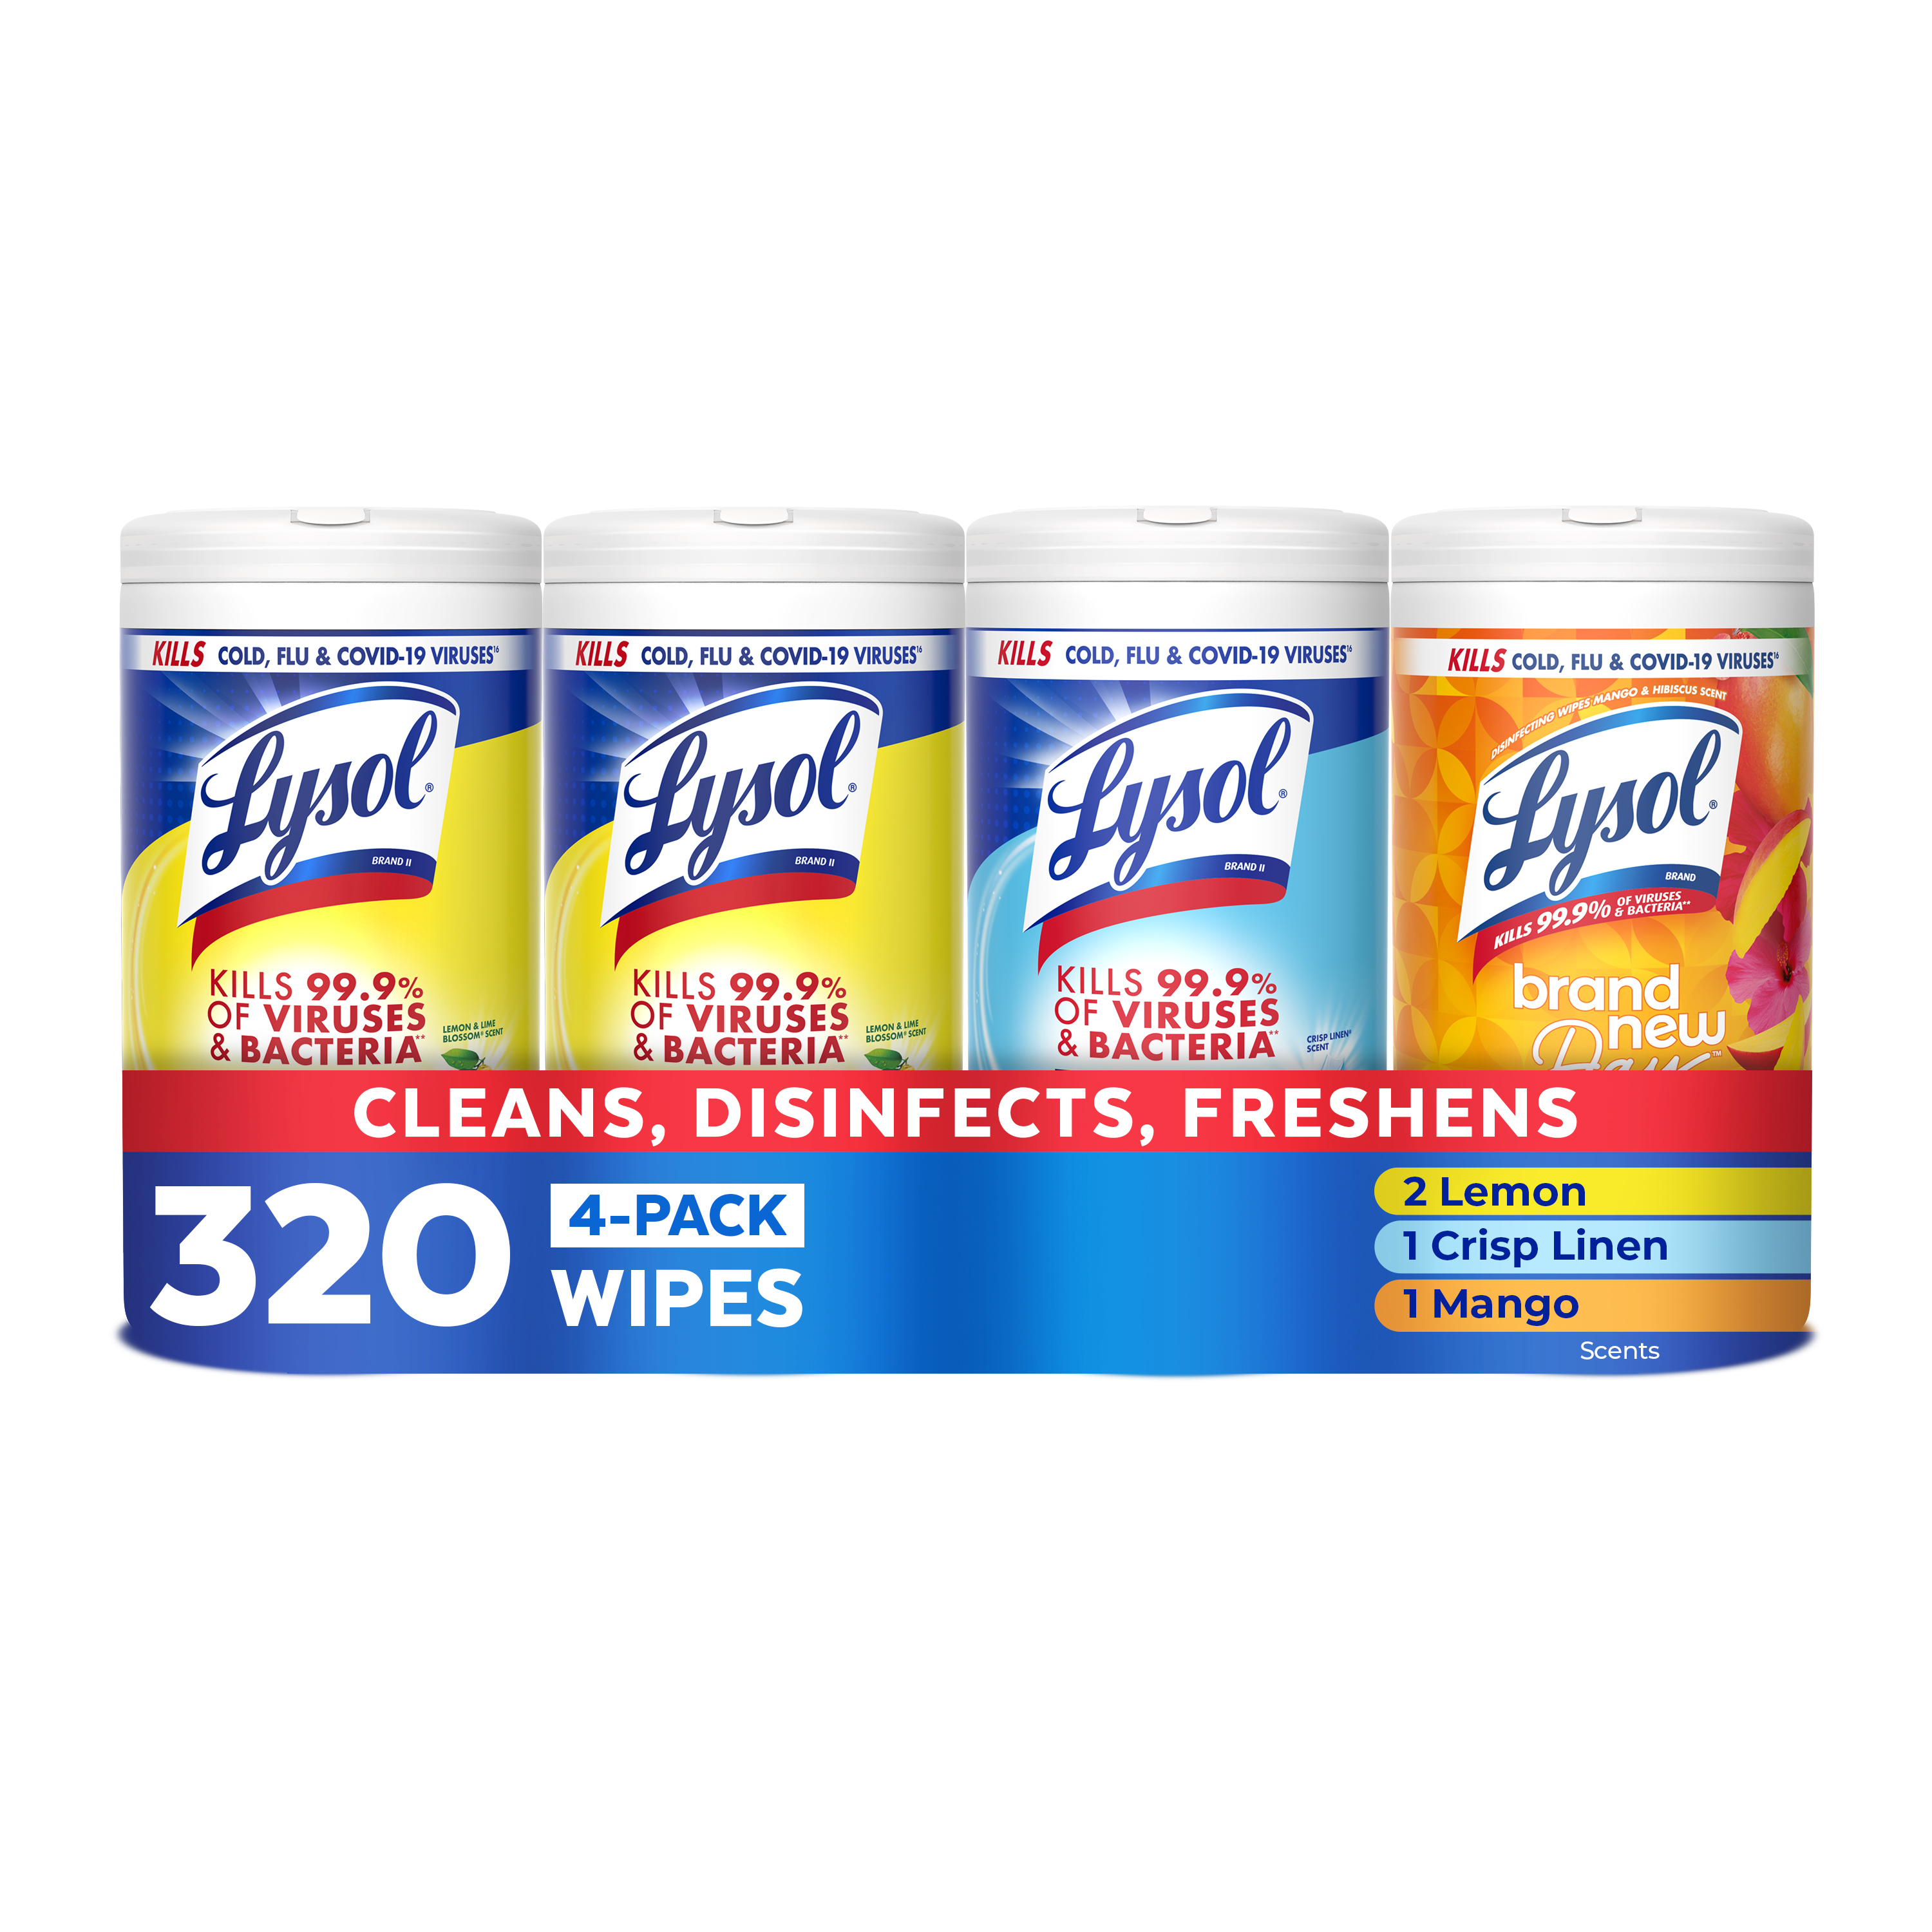
The original main image made it hard to tell how many wipes came in the pack or which scents it included. Competitor review informed the hypothesis that a clearer count, benefit line and scent labels could help shoppers understand the offer and improve conversion.
Comparison image · B
Revised image · A
02 / Design decisions
The redesign prioritized count, benefits and scents.
I set these priorities in the brief. The designer produced the artwork and refined the pack arrangement and labels, with delivery coordinated by the project manager.
Lead with the pack count
Make the total wipe count the first thing a shopper sees.
Simplify the benefit line
The benefit strip gives shoppers a quick read on what the product does.
Distinguish the scent variants
Short names and separate color bands distinguish the scents.
03 / A/B experiment
An A/B test compared both images on one listing.
I ran the test in Amazon Manage Your Experiments from July 8–14, 2026. The test tracked conversion for both the revised image (A) and the comparison image (B).
04 / Results
The revised image showed higher conversion.
Amazon reported a 99% probability that Version A performed better on this listing.
Amazon’s most-likely projection was $1.46M in annual incremental sales for the tested listing, assuming the effect persisted.
See reported sample sizes
| Revised A | Comparison B |
|---|---|
| 1,252,588 | 1,253,461 |
05 / Takeaways
The conversion result applies to the full redesign.
The count, benefit line, scent labels and layout changed together. A follow-up test could isolate the larger count and measure its contribution to conversion. The team produced ten final image variants.